In a recent survey of the student body by FCHS Journalism, FCHS students were asked how they generate income and how they choose to spend it. Approximately 220 students (15% of the total student population), responded to the survey, a majority of them being upperclassmen. The results reveal information consistent with nationwide statistics and highlight unique details about students’ relationships with their money.
Beginning with employment, 54% of students said they have an income of some sort (a formal paycheck, allowance, or revenue from a business). Over 7% of respondents said they receive income in the form of their allowance, while 31% said they are employed. According to fact-checked statistics on Zippia, 34% of teens were employed in May of 2023, compared to 30% in 2021. These results imply that despite economic recovery from the pandemic, FCHS students may be lagging in employment, something which may be due to a mix of low job availability, lack of transportation, and disinterest in working.
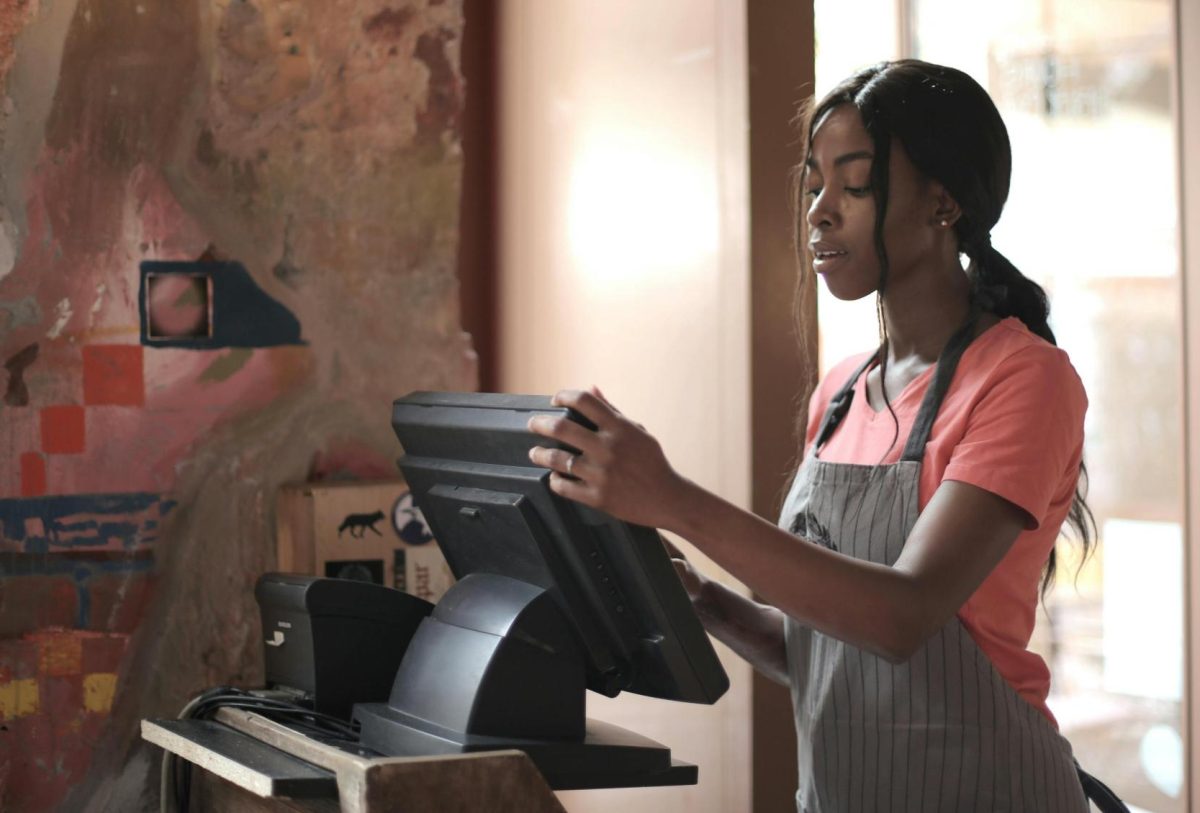
The three most common job types employed students said they work are babysitting (25%), cashiers (21%), and restaurant service, which includes hosting and serving (35%). Others have jobs in carpentry, coaching, landscaping, running errands for others, selling art, photography, cleaning, and giving swim or music lessons. A possible reason for babysitting being such a large source of employment might be because it’s generally simpler to get hired for babysitting at a young age.
Among employed students, the majority tend to work lighter weekly shifts. Over 19% work between 1-4 hours a week, 17% work between 5-9 hours a week, and 14% work between 10-14 hours a week. The next largest subset is students working 25 hours or more, making up 10% of the total dataset.
Another interesting occurrence appeared in the data for the income FCHS students said they earn, which includes wages, tips, and allowance. Approximately 16% of students earn the minimum wage in Virginia which is currently $12 an hour. Almost 22% earn less than this, which is likely explained by the large number of students working in the service industry. Most students, 27% to be exact, earn between $15-$16, while over 24% said they earn $19 or more. This may reflect students earning income from a combination of sources, or because some have higher-paying wages.
Saving money is one of the best ways a person can set themselves up for success, but just how much are FCHS students willing to save for the future? Over 10% of students said they save none of their income, 16% said they save “very little” (1-20% of their income), 23% said they save “some of it” (21-40%), 18% said they save “roughly half of it” (41-60%), 21% said they save “most of it” (61-80%), and 13% said they save “all or almost all of it” (81-100%).
When asked about their biggest motivation for saving money, 60% of students said they want financial security, 22% want to prepare for the cost of college tuition, 11% want to help out or treat their loved ones, and 8% had some other reason not listed.
The next section of the survey utilized the full sample, as it dealt with student spending habits. The first thing examined was the frequency of students’ purchases on wants and needs. Nearly 18% of students reported spending money once a month or less, while 35% of students reported spending money only a few times a month, suggesting that the majority of students have frugal spending habits. Almost 29% of students spend money once or twice a week, 14% of students spend money most days of the week, and 6% spend money every day.
Looking into what students spend their money on highlights some interesting information. Over 58% of FCHS students purchase clothing items and other apparel, such as shoes, glasses, and hats, while 46% of students buy entertainment-related goods and services like video games and streaming subscriptions. About 42% of students spend money on leisure activities and other outings like restaurants, movie screenings, and arcades, 40% of students purchase cosmetics and care products, and 33% of students purchase groceries for themselves or their households.